Spacetime UI User Guide
Last updated: March 28, 2023
Requirements
Browser: Latest versions of Chrome, Edge, Safari, and Firefox
Device: Desktop or laptop, does not support mobile devices
Features
Basic Controls
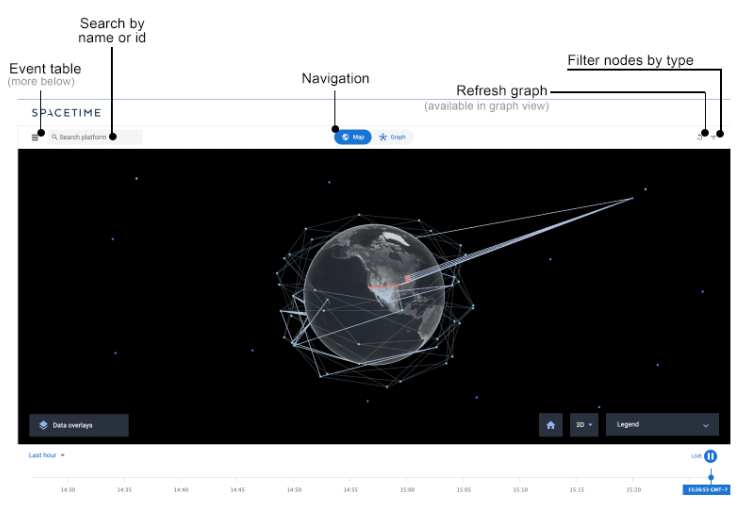
- Clicking on top-left icon will expand or collapse an event table (more below)
- Users can search in input box by node name or id
- Middle section allows navigation to the two views: map and graph
- Clicking on top-right icon will refresh the graph (only available in graph view)
- Clicking on top-right icon will allow users to filter by node type
Event Table
The event table displays status at the time on the timeline.
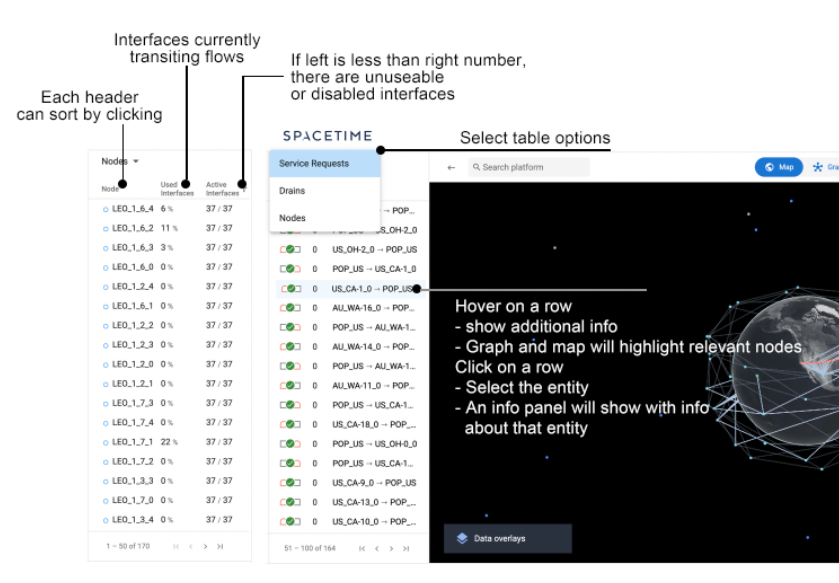
- Clicking on each header will sort appropriately
- There are 3 views for the event table:
- Service requests
- Drain - these are all DrainProvision entities.
- Nodes - these are all NetworkNode entities.
- Hovering over a row will show additional information about that entity. The graph and map will also highlight relevant nodes.
- Clicking on a row will select that entity. The graph and map will display more information about that entity (more below)
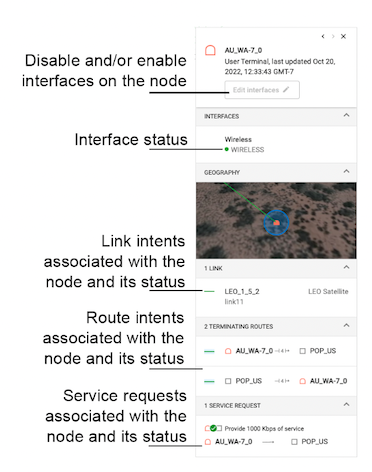
Details Cards
Clicking and selecting an entity will bring up a details card on the right side. There are 5 different types of detail cards.
Node Details Card
Refer to the legend in graph view and API documentation for link intent and route intent status meanings.
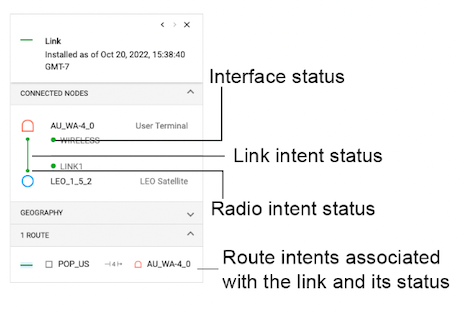
Link Details Card
Refer to the legend in graph view and API documentation for link intent, route intent, and radio intent status meanings.
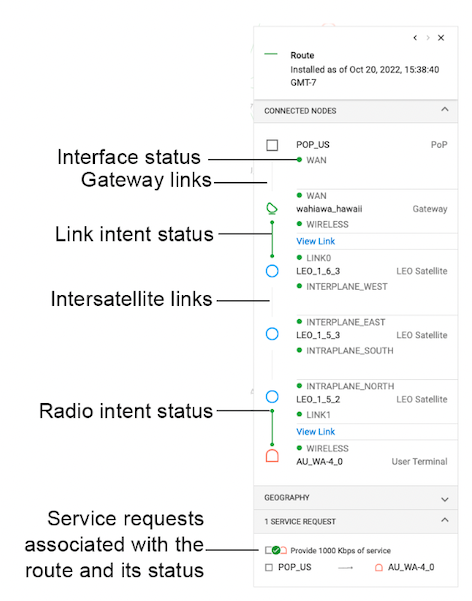
Route Details Card
Refer to the legend in graph view and API documentation for link intent, route intent, and radio intent status meanings.
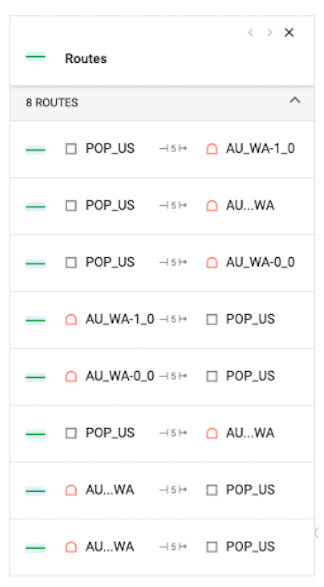
Multiple Routes Details Card
A single line may encompass multiple route intents.
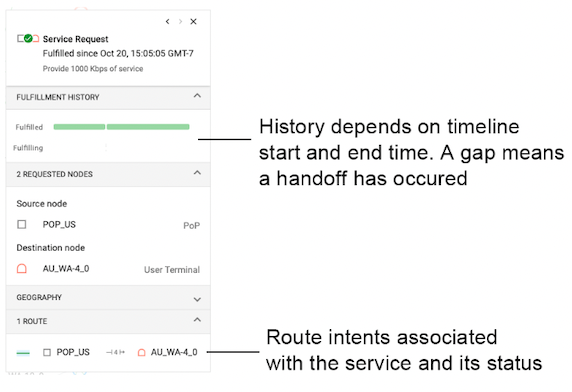
Service Request Details Card
Map Controls
- Pan view:
- left click + drag
- Zoom view:
- right click + drag
- mouse wheel scroll
- Touchpad scroll
- Rotate view:
- CTRL + left click + drag
- Scroll view:
- Shift + drag
- Select node:
- Double click
Timeline
- Drag the circle left or right to go to that point in time
- Click on the timeline to go to that point in time
- Click on play button to toggle live data on and off
- Users can use dropdown to select more granular time ranges
<!–
Link Report Overlay
Select any node and click the ‘View link report’ button on the right info panel. This overlay shows you what platforms are accessible to a selected platform by transceiver. Another way to think about it is all available links Spacetime can install. If access to a platform is not available, you will see the reason why. This is a great way to view all the platforms and links Spacetime is assessing at a given time.
 –>
–>
Known UI Bugs
Timeline feels slow: When dragging the timeline and landing on a spot, please allow 1-2 seconds for the data to properly load. There is no loading indicator.
Graph jumps around: Best way to view and understand the network in graph view is to pause the live mode.